Acoustic Transducer Testing with dScope Series III
Linked Resources:
INTRODUCTION| APPLICATION NOTES |
| WEBINARS |
| RELEVANT PRODUCTS |
The requirements for acoustic testing are quite unique within the field of audio analysis, and testing requires particular care to ensure good rejection of unwanted reflections (echoes and reverberation) and background noise. This is particularly true in a manufacturing environment where acoustic noise levels are generally quite high, space is at a premium, and measurement speeds usually need to be kept to a minimum. The requirement to minimise measurement times implies short signal durations, and therefore signal to noise ratio needs careful consideration.
Some common acoustic analysis tasks are as follows:
| Frequency Response | Distortion (spectrum) |
 |
 |
| Distortion (response) | Impedance |
 |
 |
Traditional testing methods for these results relied on sinusoidal analysis, and involved sweeping the generator frequency in order to acquire frequency responses. These sinusoidal methods can be accomplished easily using dScope (note that impedance analysis requires a small script to run - email our tech support engineers for details). However, more advanced methods have since been developed for these measurements, including multi-tones and impulse response analysis. The relative merits of these various measurement techniques are discussed below:
Sinusoidal sweep
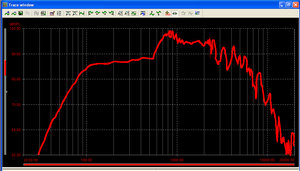
A frequency response measurement of an LF driver |
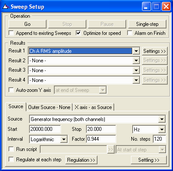
Settings for frequency response measurement |
|
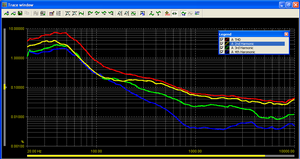
A distortion response measurement of an LF driver |
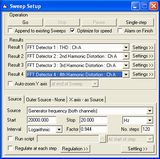
Settings distortion response measurement |
Frequency response sweeps utilise the sinusoidal signal generator function and basic amplitude analysis (either Signal Analyzer¹ or Continuous Time Detector¹ (CTD), which can also incorporate a filter function). THD+N can be analysed with a swept CTD¹ result or FFT result. THD and individual harmonics can be swept using FFT results¹. Up to 4 different results can be swept simultaneously using dScope.
Pros:
- Can use linear, logarithmic, or even user-defined distribution of data points
- Resolution can be almost arbitrarily fine - up to 1024 points over a user-specified frequency range
- Individual harmonic analysis possible up to the Nth harmonic (below Nyquist limit)
- Background noise / excess distortion can be attenuated by using the CTD band-reject filter tied to the signal generator frequency.
- Good signal to noise ratio due to low crest factor and high signal energy at all frequencies
- Acoustic reflections cannot be discriminated from the original stimulus, so 'comb filtering' can occur
- Analysis is relatively slow for high resolution sweeps, especially for individual harmonic distortion results, which require an FFT result to be captured at each sweep step
Bin centres Multi-tone
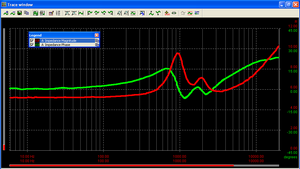 Impedance of a tweeter as measured using "bin centres" signal |
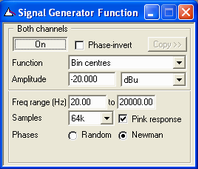 Generator Settings for "bin centres" signal |
Requires the generator stimulus to be set to 'bin centres', the FFT window to be set to 'Rectangular', and the FFT trigger set to 'Generator Wavetable'. In addition, the system must be Linear Time-Invariant (LTI). The number of samples in the FFT analysis buffer and in the signal generator sequence should be equal.
Pros:
- Can be very fast - a 4k FFT buffer at 48kHz sampling takes around 0.2 seconds²
- Can be very high resolution - up to 256k FFT points in a single capture gives approximately the same resolution as a 130,000-point linear sweep in around 7 seconds!² (at 48kHz)
- Stimulus can be weighted
- Low crest factor if "Newman" phase response selected
- Acoustic reflections cannot be discriminated from the original stimulus
- Analysis is limited to linear distribution of FFT points
- Generator signal is broad-band, so no rejection of background noise is possible
- Analysis energy is spread over the entire spectrum simultaneously - SNR suffers
- Crest factor can be poor with random phases
- Bin centres testing
- Impedance measurement using bin centres (script)
Multi-tone
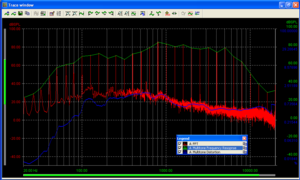 A multi-tone measurement of an LF driver |
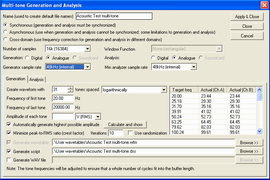 Multi-tone measurement settings |
Requires a multi-tone with less data points than the current FFT size to be configured. Allows simultaneous analysis of frequency response and distortion (harmonic + intermodulation). This is generally recommended for electronic analysis rather than acoustic analysis, as noise and crosstalk are also analysed in the same capture.
Pros:
- Can be very fast - a 4k FFT buffer at 48kHz sampling takes around 0.2 seconds²
- Can be very high resolution - up to 256k FFT points in a single capture gives approximately the same resolution as a 130,000-point linear sweep in around 7 seconds!² (at 48kHz)
- Frequency response and distortion in a single measurement - high speed for production applications
- Crest factor can be optimized
- Lower resolution of frequency response than a bin-centred multi-tone
- Acoustic reflections cannot be discriminated from the original stimulus
- Analysis is limited to linear distribution of FFT points
- Analysis energy is spread over the entire spectrum simultaneously - SNR suffers
Impulse Response
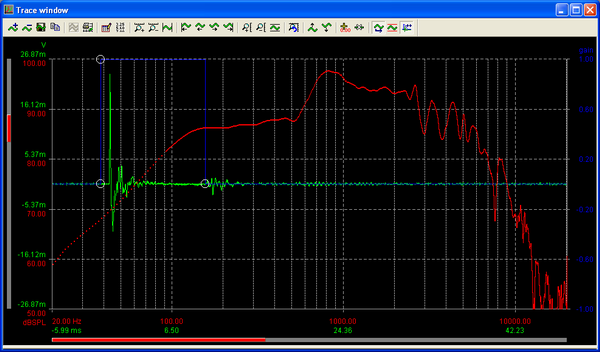 A impulse response measurement of an LF driver |
||||
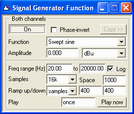 Swept sine generator settings |
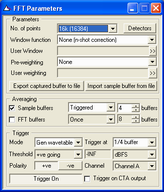 FFT settings for swept sine measurement |
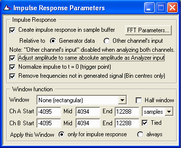 Impulse response measurement settings |
||
Traditionally impulse response measurements have been made with an impulse as the stimulus - this seldom provides enough signal to noise ratio for practical measurements. With the advent of more powerful signal processing in computers, we tend to derive an impulse response mathematically using other stimuli. Refer to the following link for further details on configuring an impulse response measurement with dScope. The basics involve selecting an appropriate generator sequence, selecting an impulse response, and defining a time domain window to include the initial impulse whilst rejecting reflections, noise and distortion components.
Pros:
- Can be very fast - a 4k FFT buffer at 48kHz sampling takes around 0.2 seconds²
- Can be very high resolution - up to 256k FFT points in a single capture gives approximately the same resolution as a 130,000-point linear sweep in around 7 seconds!² (at 48kHz)
- Generator stimulus can be flexible, allowing noise, bin centres swept (stepped) sine or user-defined stimulus to be used
- Time domain window can be used to remove reflections and some noise from the measurement
- Log swept sine stimulus also generates frequency response and all individual harmonic impulses in a single capture - high speed for production applications
- Individual harmonic analysis possible up to the Nth harmonic (below Nyquist limit)
- Log swept sine stimulus has "pink" energy content and 3dB crest factor
- Analysis is limited to linear distribution of FFT points
In addition to frequency response, distortion and impedance analysis shown above, there are many other analysis tasks commonly required by acoustic engineers, and again, supported by dScope. These include:
- Rub & Buzz Detection
- Loose Particle Detection
- Polarity
- QC testing (including limit checking and automation)
¹The dScope "Signal Analyzer" gives an un-filtered RMS reading of the signal amplitude, as well as frequency and inter-channel phase. The Continuous Time Detector (CTD) in dScope is a time domain instrument for measuring amplitudes with different bandwidths, filters, responses, units and weightings. FFT detectors in dScope are software instruments for making measurements primarily from frequency domain (FFT) data. They are very "soft" in the sense that they can be very flexibly configured in software, or can be freely programmed using scripts. dScope Series III can run up to 40 FFT detectors simultaneously. ²Analysis speed can depend on the processing speed of the host PC.
Further Resources
For further details of testing with dScope Series III, consult the dScope on-line help or download the dScope operation manual. For any more information or assistance please contact us using the form below:
App ID: 0018, Resource ID: 86

