Impulse Response Testing with dScope Series III
Linked Resources:
dScope Series III Version 1.2x releases feature a set of tools for measuring impulse responses and derived parameters.
Impulse response analysis is a powerful tool which can be used to measure acoustic spaces or transducers, as well providing an alternative method of analyzing the response of electronic EUTs.
| APPLICATION NOTES |
| RELEVANT PRODUCTS |
Principle of Operation
The principle of operation is shown in the block diagram below:

Stimulus
The basic principle is very similar to MLS analysis, where an impulse is derived by cross-correlation with a known stimulus. Here a wavetable stimulus is used which has a run length of 2^N samples. A variety of stimuli can be contained in the wavetable; the main requirement is that the aggregated spectrum of the stimulus covers the band of interest (i.e. the audio band) reasonably evenly. For this reason, continuously-swept sine waves (chirps) or noise-like stimuli are usually favoured. Using dScope, the Signal Generator should be set to Swept Sine (logarithmic) or a Bin Centres stimulus (a noise-like signal which is actually a finely-spaced multi-tone). When set to compare between channels, it is also possible to use random signals such as pink or white noise, or even music.
The stimulus is passed through the EUT and into the Analyzer. The first stage of analysis involves correlating the signal recovered from the EUT with a reference. dScope can use either the Generator wavetable or the Analyzer input from the other channel as the correlation reference, which allows useful flexibility. By using the Generator wavetable directly, it is possible to analyze two EUT channels simultaneously. On the other hand, by using the other Analyzer channel as the reference, it is possible to compare two points in a signal chain; also (if the measurement is analogue) the response of the dScope's own converters is cancelled from the result; however, only one EUT channel can be measured at a time.
Deriving an impulse response
Correlating the signal recovered from the EUT with the selected reference produces an 'impulse response' of the EUT - i.e. its theoretical output if stimulated by a perfect impulse. In dScope, the correlation is performed using an FFT-based process. It is generally more practical to derive the EUT's impulse response by this method than by stimulating it with an actual impulse, which contains very little energy and so would produce a result with poor signal-to-noise ratio. Using a stimulus with its energy spread out over time and deriving the impulse response mathematically gives much better noise immunity, but the dScope doesn't leave it there. It also provides time domain pre-averaging to reduce the effects of un-correlated noise in the measurements even further.
Getting a frequency response
In assessing acoustic spaces, the impulse response can be interesting in itself, whereas for measuring transducers or electronic EUTs it is mainly a means of deriving the device's frequency response, independent of the environment in which it is measured. The frequency response of the EUT can be calculated as the FFT of its impulse response.
A common requirement in transducer measurement is to be able to measure devices in anechoic conditions, and free from background noise (which might compromise the reliability of the results). To do this in real anechoic chambers is expensive and inconvenient in a production environment, particularly for low-cost devices. Impulse response windowing can help to solve this problem. This involves applying a window to the impulse response prior to performing the final FFT. Basically, the windowing operation allows only the desired period of the impulse response to be included, i.e. later parts which contain reflections of the stimulus can be excluded, as well as the intervals before and after the impulse response which may contain background noise. By carefully time-positioning a suitable window function over the impulse response prior to calculating the frequency response, it is possible to simulate anechoic measurement conditions.
Window functions
dScope allows any of the normal FFT Window functions to be selected for impulse windowing, in either a full or 'half-window' configuration. A half-window has only the 'right-hand' side of the specified function; i.e. it has unity gain at its start, and reducing gain thereafter. The selected window or half-window can be precisely positioned at the right time, and scaled to the desired duration, to provide optimum selectivity. The resulting frequency response is essentially the frequency response of the device in the absence of reflections and with a significant portion of the noise windowed out.
Setting up dScope for Impulse response analysis
dScope's implementation of quasi anechoic testing is a little different from some of the traditional systems such as MLSSA, but is immensely powerful when combined with the ability to set up user defined FFT detectors and scripted analysis. dScope's impulse response testing is essentially a different mode of viewing time domain data. Normally dScope displays the time domain audio sample data in a Scope trace that is exactly as it is received by the Digital Inputs or sampled by the Analogue Inputs. In impulse response mode, the time domain data is the impulse response derived as described previously. Whichever mode the dScope is in, the FFT data displayed is based on the time domain data that is showing at the time. In the steps that follow, we will describe how to set up an impulse response measurement with the dScope connected back to back.
- Configure the hardware: The first step is to load the default Configuration and then connect the Analogue Outputs of the dScope to its Analogue Inputs, either using cables or by selecting 'Generator' as the 'Source' setting in the Analogue Inputs dialogue box.
- Set up the Generator for Swept sine: In the Signal Generator dialogue box, set the 'Function' to 'Swept sine', with the default parameters (20Hz to 20kHz, log, 4k points with 250 sample space, 100 sample ramp up and down, playing continuously).
- Set up the FFT parameters: In the FFT Parameters dialogue box, make sure that the 'Number of points' is set to 4k, set the 'Window function' to 'None (Rectangular)' and 'Trigger', 'Mode' to 'Gen wavetable'.
- Check the Trace window: Look at the Trace window; make sure that the Scope and FFT Traces for channel A are displayed, and that the Scope Trace is fully zoomed out on the X axis - if not, repeatedly click the
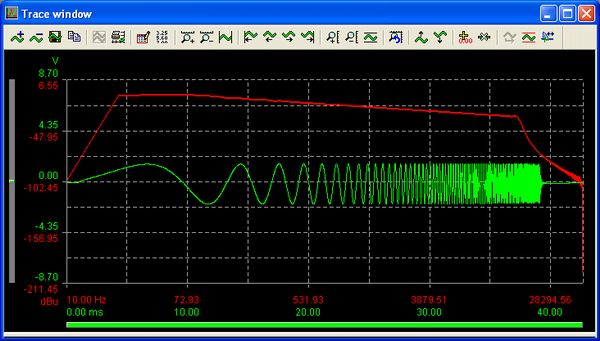
 Trace Toolbar icon with the Scope Trace selected. The Trace window should now look something like this:

The Scope trace shows the Swept sine waveform, triggering reliably at the same point; the FFT Trace shows the FFT of the stimulus, which steadily falls in-band owing to its logarithmic progression, and then rolls off out-of-band. - Set the Impulse response parameters: Now open the Impulse Response Parameters dialogue box from the Analyzer menu and check 'Create impulse response in sample buffer'. The Scope Trace should be replaced by an impulse at the left-hand side of the Trace window. To make this a bit clearer, go back into the FFT Parameters dialogue box, click in the 'Trigger at' box, enter '100' and hit [Enter]. The impulse should move to the right a little (to sample 100, in fact).
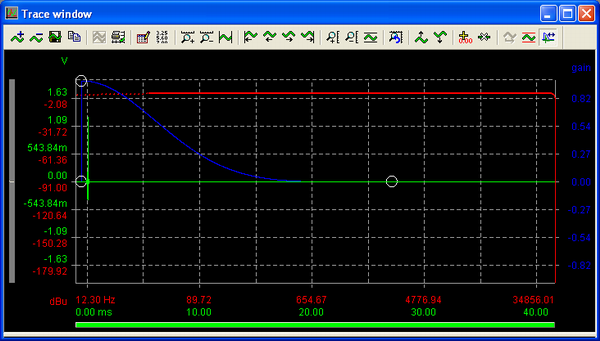
The FFT won't yet be showing the frequency response of our wire (hopefully flat) because the impulse response is probably not yet being windowed properly. Click the icon on the Trace Toolbar, and an Impulse response Window function Trace should appear, along with the Edit Impulse Window dialogue box. You can drag the Window Trace with the round "handles" on its left, and adjust its duration with the handle on its right. When you position it to include the impulse on the Scope Trace, the FFT Trace should begin to show a flat frequency response, like this:

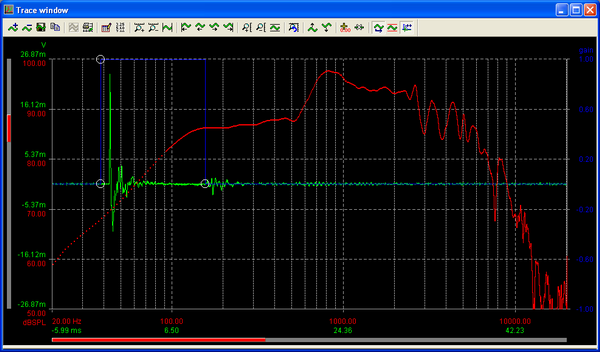
In the screen shot above, the furthest left portion of the FFT Trace is shown as a dotted line. This is because the windowed portion of the impulse response is too short to accurately derive low frequency information, so the data in this region is doubtful. Note also that at this stage in the process the FFT can be running continuously, and dragging the window updates the FFT Trace in real time, allowing you to see instantly what effect the type and placement of the Window function is having on the results. Another interesting observation: the stimulus is pink weighted (equal energy per octave), which is ideal for getting the best signal to noise ratio from real world audio transducers as it has similar weighting to music, and yet the FFT from the impulse response is effectively white (equal energy per Hz) which gives a flat FFT response. This is because it represents the transfer function of the system under test and is effectively independent of the stimulus. - Real World Measurements: This procedure shows the basic impulse response analysis process. It should now be a straightforward matter to insert a real EUT and to measure its response. The below is a screen shot of a real measurement of a bass driver resting on a surface.

App ID: 0013, Resource ID: 88

