Broadcast Audio Testing with dScope Series III
| APPLICATION NOTES |
| PRESENTATIONS |
| QUICK STARTS |
| WEBINARS |
| RELEVANT PRODUCTS |
The radio broadcast signal chain is a long and complex path involving electro-acoustic transducers, mixers, storage media, interface channels, signal processing and more. Each process within this path can induce distortions upon the original audio signal, even when working correctly. These distortions can become intolerable when devices fail or are incorrectly configured or interfaced, and should therefore be analyzed both at the installation stage and also during ongoing use.
Although the main motivation for ensuring acceptable audio performance is to ensure that the audience experience is not compromised, audio specifications often form part of contractual obligations between network regulators and providers, thus reaffirming the need to continually analyze broadcast quality. Analysing live radio performance can be a difficult problem for engineers, despite what might appear to be a fairly simple brief:
"Determine whether the audio quality of a radio broadcast is within agreed acceptable limits."
Answering this brief, in the context of today's audio analysis tools, will form the focus of this discussion.
ANSWERING THE BRIEF
In order to highlight the difficulties of this problem, the task can be broken down as follows:
- Define objective parameters which determine perceived audio quality
- Establish 'acceptable' performance limits for these parameters
- Measure parameters at receiver locations during live broadcast
- Analyze and log the data
Subjective evaluation of audio quality is a somewhat contentious issue, and we have yet to fully characterise the relationship between objective measurable data and subjective listener experience. However, there are a number of parameters that are understood to correlate closely with perceived audio quality, as follows:
- Bandwidth
- Amplitude linearity
- Noise
- Harmonic distortion
- Intermodulation distortion
- Cross-talk
There are limitations to these tests, however: These tests focus on the short-term, steady-state response, but this does not guarantee that equipment will perform reliably over the long term. Radio engineers must ensure that systems are free from intermittent 'glitches', 'drop-outs' or drift caused by poor interconnections, inadvertent asynchronicity or faulty equipment, but these defects can be difficult to identify using these short-term tests. Some modern audio analyzers have sufficient flexibility to provide reliability checking, and these tests should be included as part of the signal chain commissioning process. Whilst beyond the scope of this article, more information on reliability testing can be found in the broadcasting audio testing applications page. Further insight into today's audio analyzers and their capabilities may be found by a web search of phrases such as 'digital audio analyzer'.
Define Limits for Objective Parameters
Despite the difficulties in defining the limits of perceptually 'transparent' audio, most of the parameters identified above will have limits imposed by the broadcast signal chain. In some cases, limits are imposed by the broadcast channel itself: For example, the modulation bandwidth of FM radio is 30Hz - 15kHz, thus providing us with a suitable test limit for bandwidth analysis.
In other cases, equipment used within the signal chain will be the limiting factor of performance: Dynamic compression will generate harmonic distortion; noise from microphone pre amps may limit system dynamic range; lossy compression CODECS will exhibit complex noise and distortion characteristics. All of these issues, and more, need to be characterised in order to ascertain the limits of performance of the broadcast system as a whole.
Once the audio signal path is characterised, typical test specifications / limits for an FM stereo radio transmission might look something like the following:
| SPECIFICATION | |
| Bandwidth (-3dB): | 30Hz - 15kHz |
| Amplitude linearity (40Hz - 13kHz): | +/-1dB |
| Total distortion (@ +18dBm*): | <1% |
| Signal-to-Noise Ratio (@ +10dBm*): | >50dB (un-weighted) |
| Crosstalk (@ +10dBm*): | >55dB |
Measure Parameters during Live Broadcast
Typical radio programme material cannot easily be analyzed in terms of the parameters defined above, hence test tones are normally used for analysis. Test tones are fairly objectionable to listen to, so their use in live broadcast is generally restricted, and typical test 'windows' may be as short as a few seconds and limited to perhaps once daily.
The test window duration can prove to be a tough engineering challenge: It can take several minutes or more to fully characterise an audio device using the techniques laid out in AES17, for example, but this is simply not practical during a live broadcast, so an alternative approach to these traditional testing methods is required. These alternative techniques will be discussed in more detail later.
Analyze/ Log the Data
Broadcast networks can cover vast territory, and ideally the entire network needs to be analyzed on an ongoing basis. This implies large amounts of test data, and therefore that the analysis task requires automation. Ideally an analysis system for radio transmission should be capable of the following automation functionality:
- Detect when test tone sequences commence
- Capture all necessary data within the available time window
- Analyze the data and generate test results
- Compile and send reports to a central administrative location / database
RECENT DEVELOPMENTS IN AUDIO ANALYSIS
Digital Audio analyzers and FFT Analysis
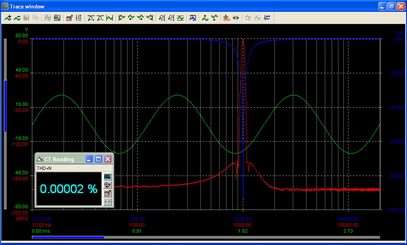
THD+N of a 1kHz sine wave (green trace) measured using an analogue 1/3 octave band-reject filter (blue trace). FFT of sine wave also shown (red trace)
(click for a larger view - opens in new window)
Figure 2: FFT THD Measurement
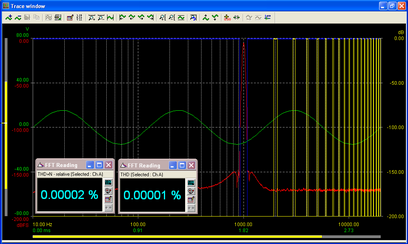
THD+N (blue filter trace) and THD (yellow filter trace) of same 1kHz sine wave measured using digital frequency domain filtering
(click for a larger view - opens in new window)
One advantage of processing signals in the digital domain is that analysis filters are not subject to the same hardware constraints (and costs) associated with analogue systems, giving us more flexibility and power. Take distortion, for example: Using an analogue analyzer, we can measure the distortion of a system by applying a sinusoidal signal to our EUT input and applying an appropriate band-reject notch filter to the EUT output. We can then measure the output from the filter giving us the sum of the harmonic distortion components and noise (THD+N) - refer to Figure 1.
In the digital domain, we could simply opt to make an equivalent distortion measurement using a digital realisation of this analogue notch filter. However, FFT analysis offers us additional flexibility: Once a signal has been translated into discrete frequency domain components, we can be highly selective as to which of these signal components to include or exclude from our analysis, and thus true brick-wall topologies are made possible, with no irregularities in amplitude or phase response. We could therefore choose to employ a brick-wall filter to measure THD+N with greater precision than with our analogue analysis, or we could use a series of band-pass notch filters positioned at the harmonic frequencies of the generator signal to analyze just the total harmonic distortion (THD) - refer to Figure 2. In this latter case, we now have the power to resolve the noise and distortion of the EUT independently, a feature not generally possible with analogue hardware due to the prohibitive hardware costs.
Multi-tone Testing
A further benefit of digital analyzers is the potential to generate and analyze waveforms of arbitrary complexity: Whilst analogue oscillators, filters and voltmeters are discrete hardware components, with inherent cost-related topological limitations, DSP provides the potential for a signal generator or analyzer to be as complex as the software designer chooses, at no extra cost other than that involved in developing the appropriate code. Generator and analyzer functionality can even include options to be entirely user-defined if sufficient flexibility is designed into the system.
Multi-tone Frequency Response
This increased generation and analysis potential can enable more advanced measurement techniques than conventional methods. The AES17 procedure for measuring frequency response, for example, is to sweep the frequency of a sinusoidal generator through a series of steps, and to monitor the output amplitude of the equipment under test (EUT). This can be a time-consuming process, especially for high resolution measurements: The analyzer must allow for settling / convergence and any EUT latency at each sweep step before logging a result. A 200-point swept-sine measurement might take a significant fraction of a minute to execute in a system with zero latency. Compare this with a more advanced signal generator, which could be configured to excite every possible bin frequency of an FFT analyzer simultaneously: A frequency response can be derived by plotting the amplitude at each FFT bin, and therefore a '4k' (4096-point) FFT analysis, with 2048 data points in the sub-Nyquist band, will give more than 10 times the resolution of a 200-point sinusoidal sweep, and can execute in a fraction of a second.
Multi-tone Noise and Distortion
We can develop this powerful technique further if, instead of exciting all FFT bin frequencies with our signal generator, we chose to excite a smaller number of frequencies. We can then analyze not only the bins occupied by signal frequencies (to analyze the frequency response), but we can also simultaneously analyze the bins unoccupied by signal frequencies (to analyze the noise and distortion response).
We can strategically place the multi-tone signal components at even-numbered FFT bin frequencies, and this in turn guarantees that any harmonic distortion components (integer multiples of the signal frequencies) and intermodulation distortion components (sum and difference products of the multi-tone components / harmonics) will also end up in even-numbered bins. The odd-numbered FFT bins will therefore contain only noise, and we then have the ability to discriminate between distortion and noise components.
Multi-tone Crosstalk
We can even choose to offset the tone frequencies between the two channels of a stereo system, and if we analyze the channel A signal frequencies on channel B (and vice-versa), we can measure the cross-talk response.
All of the above measurements can be achieved in a single capture of an FFT buffer, and our EUT can potentially be fully characterised in under a second. This represents a huge time saving over the conventional AES17 characterisation process, and illustrates the enormous power of multi-tone measurement techniques.
Interpreting Multi-tone measurements
It should be noted that whilst AES17 measurements are generally made at single frequencies / bands, multi-tone measurements are integrated over the entire spectrum. In the case of distortion, for example, an AES17 THD+N result would be the sum of all harmonic components of a single tone (plus noise). In the multi-tone case, however, we have a number of simultaneous signal frequencies, resulting in many more harmonic and intermodulation components at the EUT output; the two measurements will therefore give different results. Engineers may want to 'translate' the multi-tone results into a more familiar context, and the solution is simply to characterise a known 'golden reference' unit using the familiar AES17 methods, and then to re-characterise this same unit using multi-tone techniques. We can then test a device of the same type to establish a pass / fail result relative to the reference multi-tone result.
Multi-tone - Conclusion
The rapid and comprehensive nature of multi-tone tests make them ideally suited to analysing live radio broadcasts: The analysis techniques described above apply equally well to the output of an FM demodulator or DAB decoder in the field as they do to any other EUT on an engineer's test bench, thus comprehensive evaluation of radio broadcast quality is possible in a very short time window.
dSCOPE SERIES III AUDIO ANALYZER
The dScope Series III analyzer is an audio test and measurement system highly suited to the demands of radio engineering. The system comprises a Windows® software application and an external audio-processing interface. The dScope Series III architecture makes the most of the processing and multi-tasking capabilities of the Windows® platform, allowing the system to measure many parameters simultaneously.
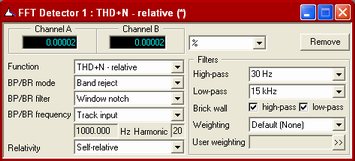
dScope FFT Detector configured to measure THD+N over 30Hz - 15kHz bandwidth, with brick-wall high pass, low pass and band reject filters
(click for a larger view - opens in new window)
Figure 4: dScope Multi-tone configuration window
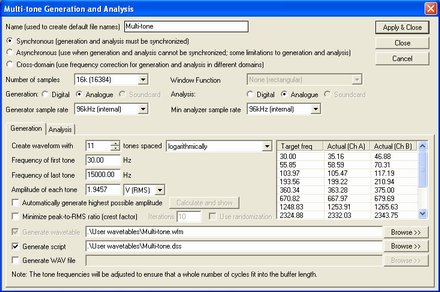
Figure 4: dScope Multi-tone generator configuration window
(click for a larger view - opens in new window)
Figure 5: Multi-tone analysis
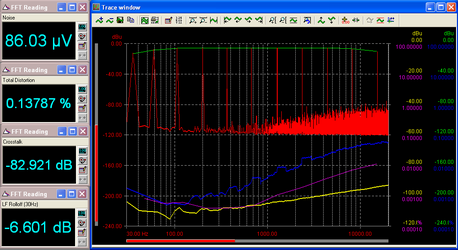
dScope Multi-tone analysis of EUT using signal configured in Figure 4. Single channel shown for clarity.
FFT - red trace; Frequency response - green trace; Distortion response - blue trace; Noise response - yellow trace; crosstalk response - purple trace
(click for a larger view - opens in new window)
dScope also provides the user with up to 40 stereo 'FFT Detectors'. These FFT detectors exploit the power of the host PC's processor, enabling up to 40 different parameters (x 2 channels) to be measured simultaneously from a single buffer capture. In addition to the standard inbuilt measurement functions, dScope's FFT detectors can also be customised using VB Script commands, enabling user-defined filter functions and analysis algorithms. Figure 3 shows dScope's FFT detector configuration window configured to make a standard THD measurement over the FM radio bandwidth of 30Hz - 15 kHz, using brick-wall analysis filters.
dScope Multi-tone Analysis
dScope features advanced multi-tone configuration tools, allowing the user to configure a customised multi-tone signal, and an appropriate series of FFT Detectors, in an intuitive configuration wizard. Figure 4 shows dScope's multi-tone generator configuration panel, and Figure 5 shows the dScope's analysis of this signal. The analysis has been configured to include signal amplitude, noise amplitude, distortion and cross-talk, in addition to plotting these results with respect to frequency. All of the information visible in Figure 5 has been captured from a single buffer of audio data, in this case a buffer size of 16k points (around 0.3 seconds of audio at 48kHz FS).
dScope Automation
dScope also incorporates VBScript programming tools, enabling automation and expansion of the system. For example, in the automated radio broadcast monitoring scenario, there is a requirement to discriminate between program material and multi-tone test sequences, in order to trigger analysis at the appropriate time. This can be accomplished within dScope by configuring a series of additional FFT detectors with band-reject filters centred on individual multi-tone component frequencies, and testing for the condition that all of these FFT detectors output a signal level above a defined threshold. If all FFT detector outputs meet this condition, then the multi-tone signal has been detected, and analysis can be triggered.
Once this trigger condition has been met, the time domain sample buffer can be filled, and this completes the data acquisition stage. Signal processing and analysis can then commence, and once complete, the entire set of data can be compared to pre-defined pass / fail test limits. dScope's VB Script commands enable the system to interface with other Windows® processes, so these test results could be automatically written to a spreadsheet, attached to an email and sent to a central location, or streamed directly to a remote database, using the host PC's TCP/IP connection. An illustration of using dScope script commands to send test results via email is available here. This automated analysis and communication functionality enables the system to analyze and log our test tone bursts on an ongoing basis, entirely free from user input, and thus satisfies all aspects of the brief laid out in section 1.0.
More detailed information on the dScope analyzer is available from www.prismsound.com. In particular, an illustration of how the multi-tone test techniques discussed in this article have been applied to solve the problem of live FM broadcast analysis is available in the transmission monitor script page.
CONCLUSION
We have discussed the requirements for, and the difficulties of, analysing the audio quality of live radio broadcast content. Particular attention has been paid to the parameters that we need to analyze, and to the difficulties of measuring these parameters using conventional test techniques within a limited time window. A fast and comprehensive digital test technique involving multi-tone signal generation and analysis has been introduced, and shown to be ideally suited to the restrictions that radio broadcast imposes. Prism Sound's dScope Series III analyzer has been introduced as one possible instrument to facilitate this type of measurement, and has been shown to be a system which supports comprehensive automation, and is therefore ideally suited to the task of answering the initial brief.
This article originally appeared in the February 2007 edition of Radio World Engineering Extra magazine. starting on page 20.
Further Resources
For further details of testing with dScope Series III, consult the dScope on-line help or download the dScope operation manual. For any more information or assistance please contact us using the form below:

